What have global data sets that estimate population density, economic productivity, measles outbreaks, rural poverty, resource footprints and electrification rates, urbanization and suburbanization, or average wages in common? They are all based on nighttime imagery of city lights captured by the Operational Line Scanner (OLS) sensor on the satellites from the US Defense Meteorological Satellite Program (DMSP).
History
What should later become the workhorse of geographers and economists was initially a completely accidental by-product: of a cold-war era military satellite program—launched in the 1950s by the US Air Force for estimating cloud cover and precipitation for reconnaissance missions. Army engineers discovered that the sensors were sensitive enough to capture artificial radiance of cities during moonless nights without cloud cover.
In 1978, Thomas A. Croft published the first global composite of night-time images in the Scientific American. At that time, the image data had to be manually stitched together from analog films ejected in capsules from the satellite, which had to be laboriously recovered by the military. Today, the Black Marble data set has become one of the most popular motifs of space imagery.
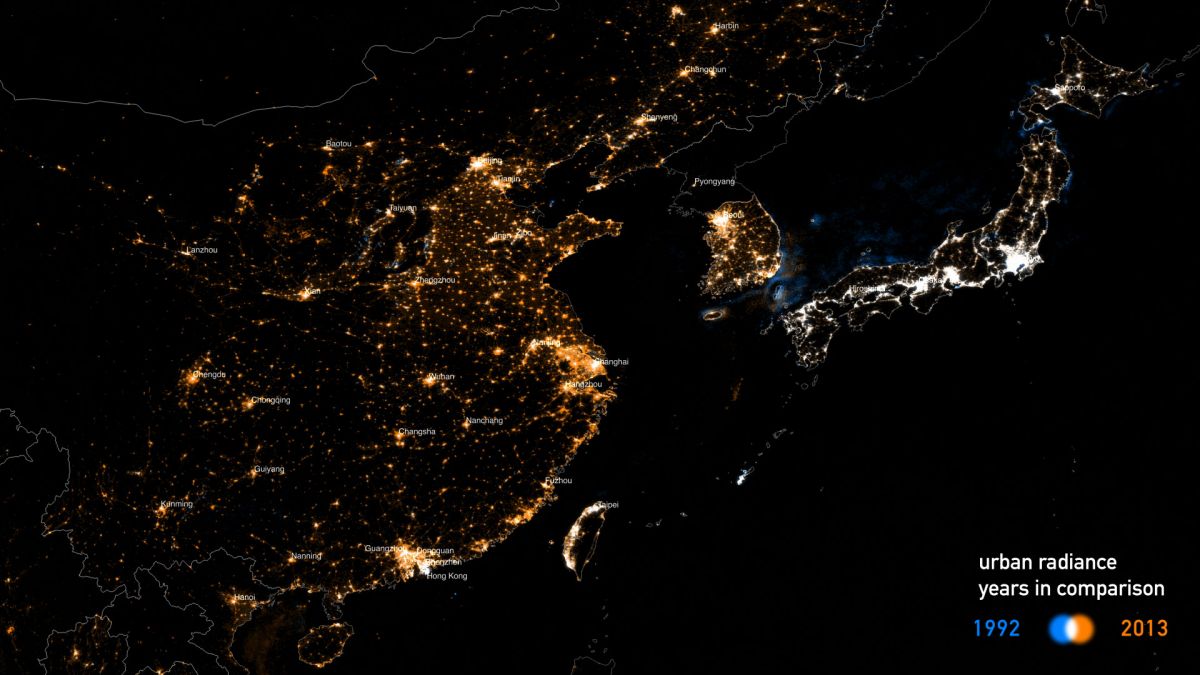
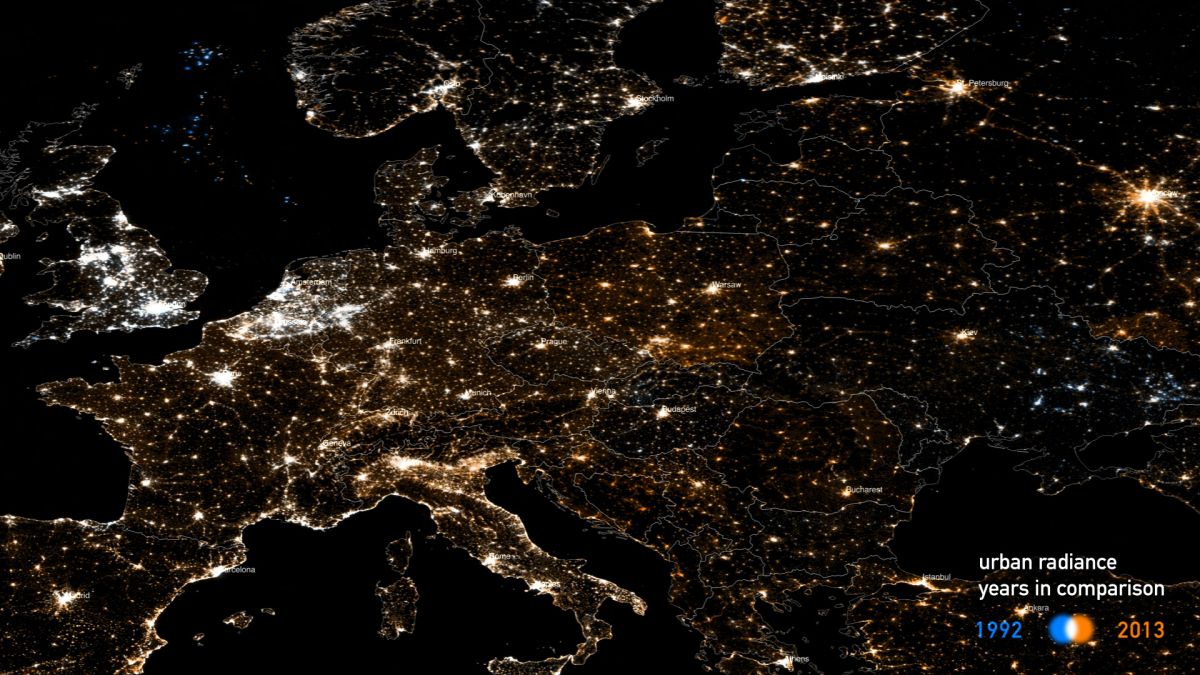
While DPMS images are usually used to show regional differences, this project visualizes temporal change in urban radiance from 1992 until 2015. It is the first interactive visualization of radiance time series data.
How to read the images
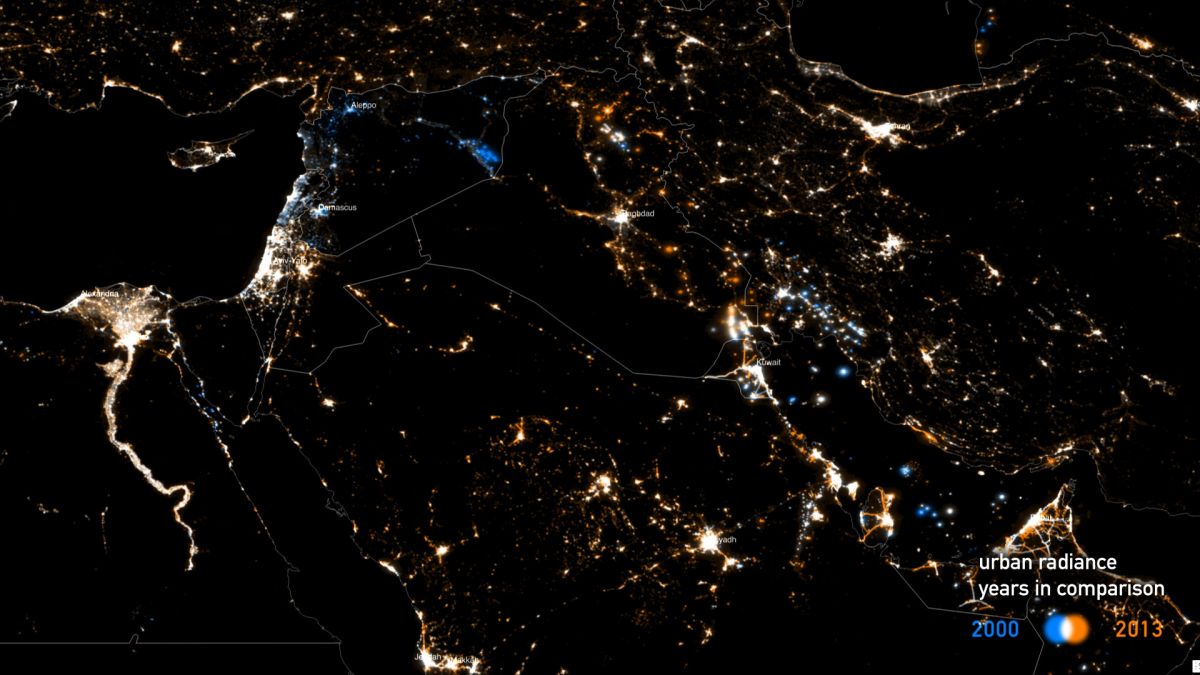
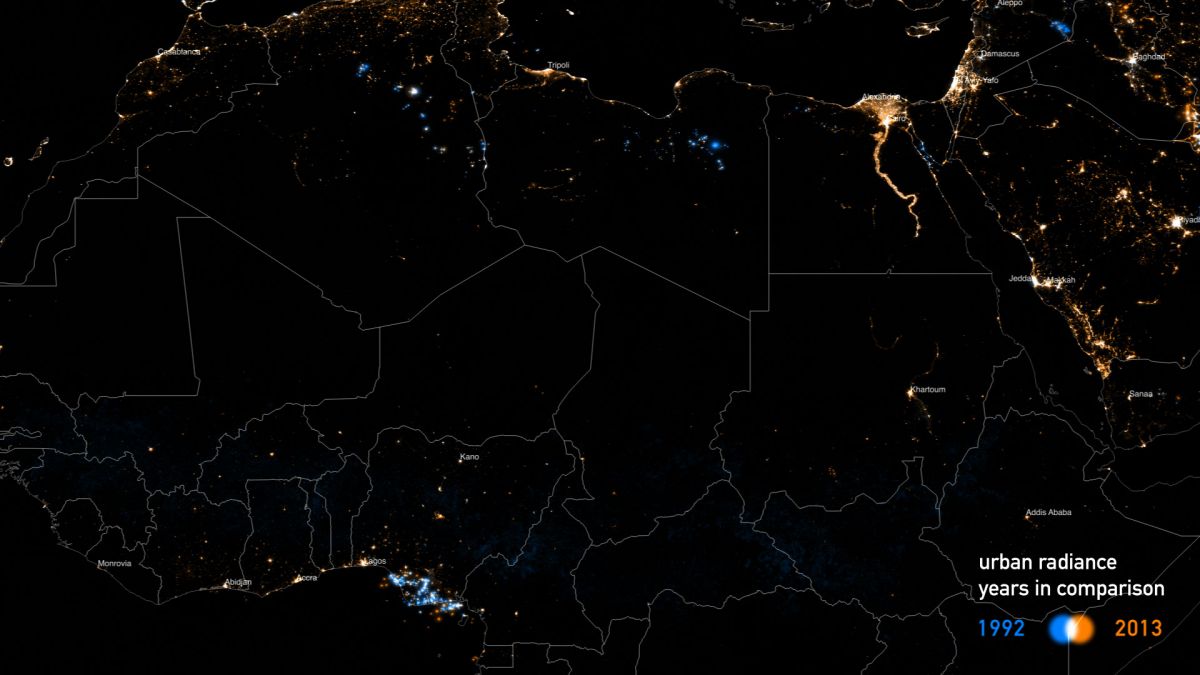
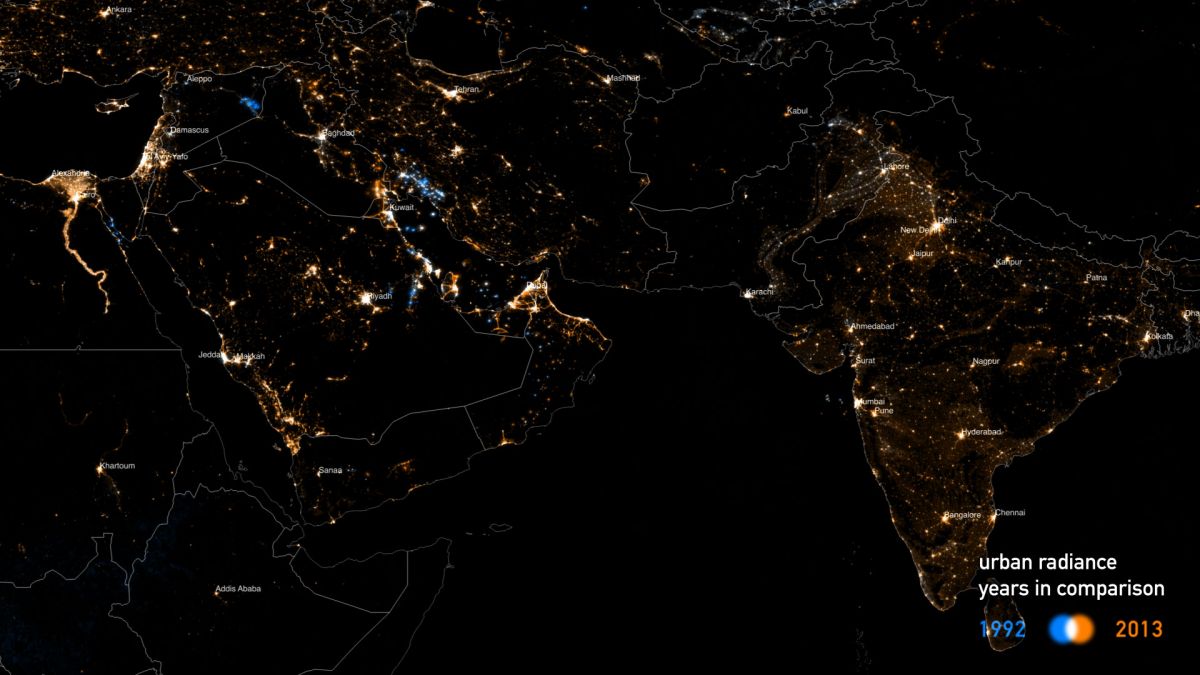
The maps are a composite of two different points in time. Blue indicates the earlier, orange the later point: together, they add up to white. Black and white areas did not change. Blue areas are areas that got darker over time. Orange areas increased in brightness.
Methods
Radiance information is compared with country-level GDP and Population data from the UN. To this end, the frequency-normalized satellite composites were re-projected into the equal-area Sinusoidal projection and summarized by brightness. Tools used: R and Qgis.
Despite its robustness for spatial analysis, DMSP composites are noisy data. Original composites contain artifacts originating from gas flares, Aurorae Borealis, variations due to cloud cover and sensor technology. In highly illuminated areas such as Singapore, brightness is clipped to a maximum value. Since the sensors are not calibrated for measuring urban radiance, the resulting values are dimensionless.