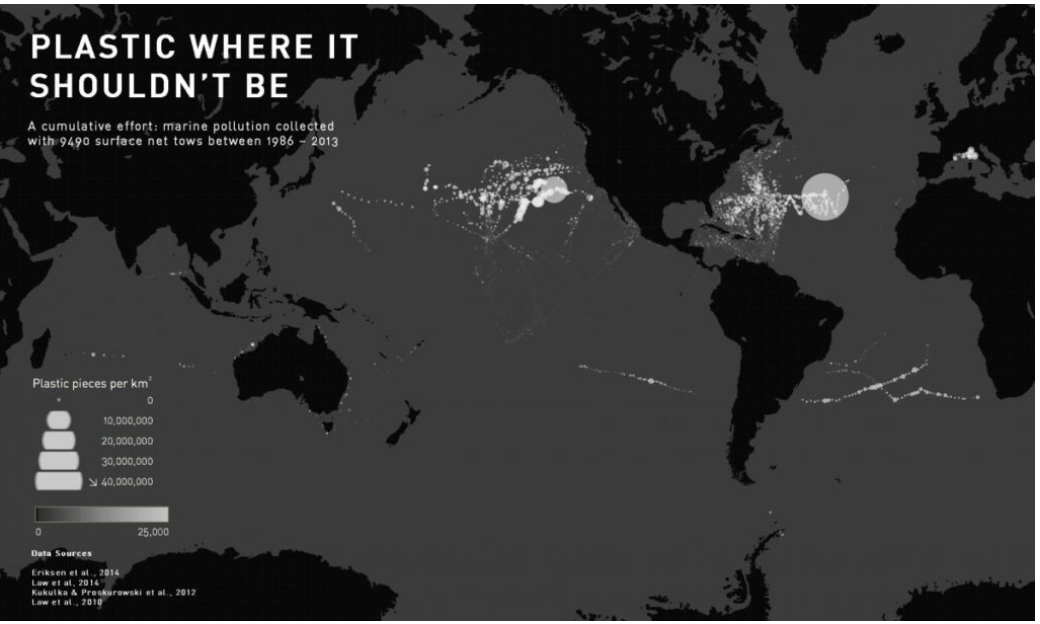
I am perpetually working to visualize my scientific research on marine plastic pollution in diverse and creative ways, harnessing the affordances of new software tools to present these visualizations to a broader audience. “Plastic where it shouldn’t be” combines four large-scale plastic marine pollution datasets, each published in a different scientific journal over the last five years, totaling 9,490 surface net tows. Three of the datasets are published in articles that I have co-written, while the fourth was published just last December (2014) by Marcus Eriksen and colleagues. As important scientific discoveries and information are often isolated in discrete proprietary journals, going unread by most, I hope that offering a simple, global graphic will help illuminate the “big picture” of marine pollution. As more plastic pollution datasets become publicly available, I plan to incorporate them into this graphic.
Please note: just because there is no plastic displayed in a certain region does not mean that it isn’t there. The open ocean is vast and pollution research is both time- and cost-intensive. Though many scientists have spent countless hours observing and documenting pollution in the ocean, we have a long way to go in learning more about the dynamics and ecological systems surrounding open ocean debris, particularly in the Indian and South Atlantic Oceans.
I am often asked, “shouldn’t we clean it up?” The answer is emphatically ‘no’ for many reasons, including the ironic reliance on petrochemicals to reach the middle of the ocean (using more than you would be cleaning up) and that sieving the upper ocean for debris would have destructive impacts on the base of the food web that lives there. Our best bet is to ‘turn off’ the pollution faucet at home – avoid using single-use plastics, and participate in a beach cleanup if you can!
By

Skye Moret
Design and data collection
IN THE NEWS
Science Journal: Plastic Accumulation in the North Atlantic Subtropical Gyre
ES&T: Distribution of Surface Plastic Debris in the Eastern Pacific Ocean from an 11-Year Data Set
The Boston Globe: Teaching Scientists how to Visualize their Data

