
People In This Story

Departments In This Story
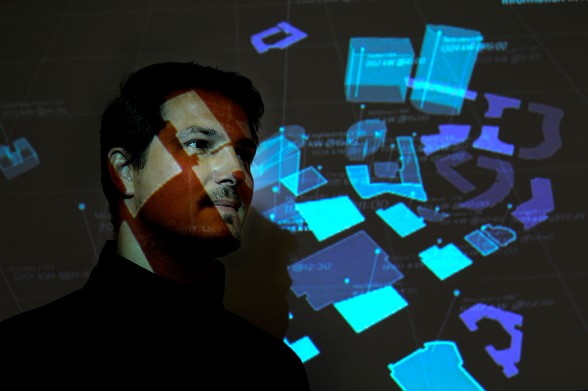
Kristian Kloeckl, Design faculty and his graduate students have created two interactive data visualizations that reveal how the bustling activity on campus is fueled by energy consumed by Northeastern University’s buildings.
On this day two years ago, on a Sunday at 6:15 a.m., the Curry Student Center hit its peak rate of electricity consumption. Four hours later, the Marino Center hit its peak (378 kW). The Mugar Life Sciences Building topped out at 681 kW at 2:45 p.m., and Matthews Arena hit its ceiling 15 minutes later (449 kW).
Individually, these data points may seem mundane. But using two years’ worth of data—2013 and 2014—associate professor Kristian Kloeckl and his students have created two interactive data visualizations that reveal how the bustling activity on campus is fueled by energy consumed by the university’s buildings.
The visualizations are part of an exhibit at Gallery 360, titled “Northeastern Energy Flows,” that opened last month and will be up into the fall semester. The exhibit features computer screens for passersby to stop and interact with—users can select specific days, weeks, and months along the two-year timeline to view—as well as short videos projected on the walls and floor that explain the project.
Read the entire story at news @ Northeastern.
Image: Kristian Kloeckl, standing in front of a projection featuring the “City of Peaks” visualization.
Related News

Celia Pearce Receives MEA 2026 Award for Outstanding Scholarship
July 20, 2026

Rekindle ignites player emotions for next-level VR immersion
July 3, 2026

OASIIS Lab uses VR to make injury recovery less stressful
June 22, 2026