
N/A
November 30, 2021
The recent opening of the new Center for Netherlandish Art (CNA) at Boston’s Museum of Fine Arts continues a long tradition of collaboration between the museum and Northeastern University’s College of Arts, Media and Design. The Center, formed to promote the study and appreciation of Dutch and Flemish art, launched in tandem with a suite of new galleries, including a rotating exhibit developed in partnership with faculty and students from CAMD’s Experience Design Lab and the Co-Lab for Data Impact: Associate Professor Kristian Kloeckl, Assistant Professor Pedro M. Cruz, and graduate students Shan Wei and Niyati Vijay Kothari.
The inaugural CNA exhibit analyzes the competitiveness of the Dutch art market in the 17th century during which, according to Christopher Atkins, the Van Otterloo-Weatherbie Director of the Center for Netherlandish Art, “in the span of about 100 years, five million paintings were created in an area about the size of the state of Maine.”
Atkins reached out to Kloeckl and his team to help them create data visualizations to communicate complex ideas and contexts to better help museum patrons understand the specific environment in which these works were produced.
“Within a museum you’re often limited to very traditional means of presentation by means of a label, then we have word limits, which is about 75 words so it’s really hard to communicate complex ideas and deep data,” Atkins said. “We’re really interested in the data visualization as a way to communicate a lot of information and in a new way to also create a new experience within the gallery to as another type of learning opportunity.”
To create the two visualizations used in the new exhibit, Kloeckl and team worked with the Netherlands Institute for Art History (RKD) in The Hague, who host the world’s most comprehensive dataset on 17th century Dutch and Flemish artists and artwork, containing information on 374,330 artists and 258,832 works of art from the 15th century to the present day. Using custom algorithms, they extracted from the raw ontological datasets 46,038 artworks from 1,932 artists centered around the 17th century.
“We worked together with the RKD to make the database usable for our purposes,” said Kloeckl. “It’s challenging to work with because art history research is not linear so our understanding of artists and artists work from that far ago changes and evolves over time to the point that dates of birth and death are revised for an artist and paintings are reattributed to other artists so it’s a very organic dataset that poses its own challenges.”
Over the summer and fall of 2021, the CAMD team worked in “a very collaborative effort” with the CNA through nearly weekly meetings, according to Kloeckl. “It was a triangular collaboration that really shows what can happen when you get people together, especially from different areas of expertise,” said Atkins.
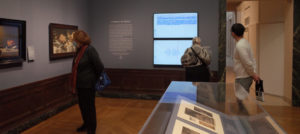
The final visualization videos were created to evolve with the data and are on display on large 50-inch screens within the gallery.
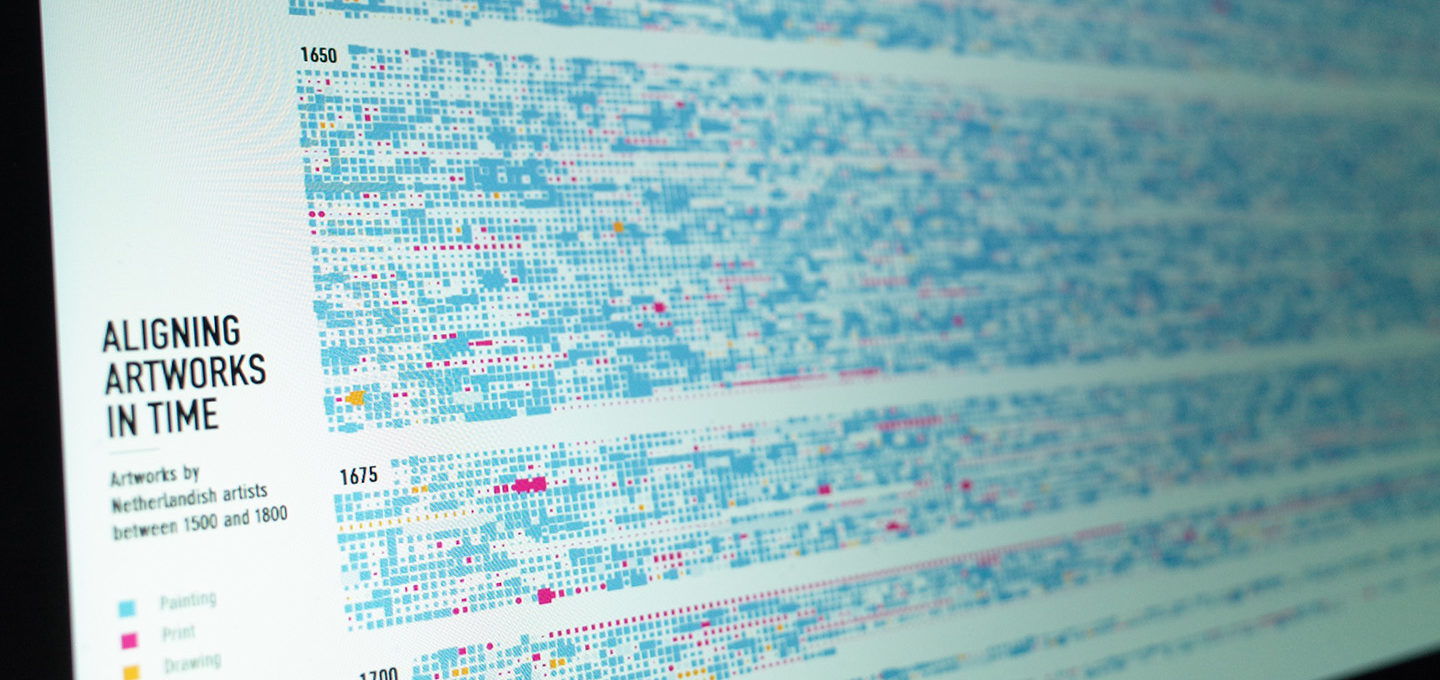
The first visualization is an adaptive timeline plotting the sheer volume of works produced in the Dutch Republic during the 17th century. The visualization does not plot data points on a linear timeline, but instead elongates and compresses to give a better sense of the amount of works produced in a given year. The second visualization is presented as an animated flipbook focusing on individual artists and their lifetimes of work, offering a unique view of the diversity of productivity over time.
“This collaboration with Kristian and his team is really exciting for us as a way to connect the museum and the collections to the local academic community, but in perhaps an unexpected way,” said Atkins.
The resulting work is an interdisciplinary, student-faculty project that “provides a complementary understanding of the sheer number of paintings as well as how each individual artist had a quite unique and personal history in terms of productive output,” said Kloeckl.