
N/A
April 25, 2019
CAMD graduate student Libby Thomas, Information Design & Visualization (IDV), recently completed her Data Dress project, which summarizes 160 years of census data into three colorful hand-stitched charts. The project was developed for her Information Design Studio class, taught by CAMD faculty member Pedro Cruz, and pursues the course theme of “diversity” by exploring the diverse experiences of women who are the same age, but have very different life situations. As a 25-year-old woman herself, Libby decided to focus on that age group, but expand her analysis to all 25-year-old woman in the United States today (from all different backgrounds) – and explore how this data stacks up against women’s experiences in the 1950s, or even 1850s.
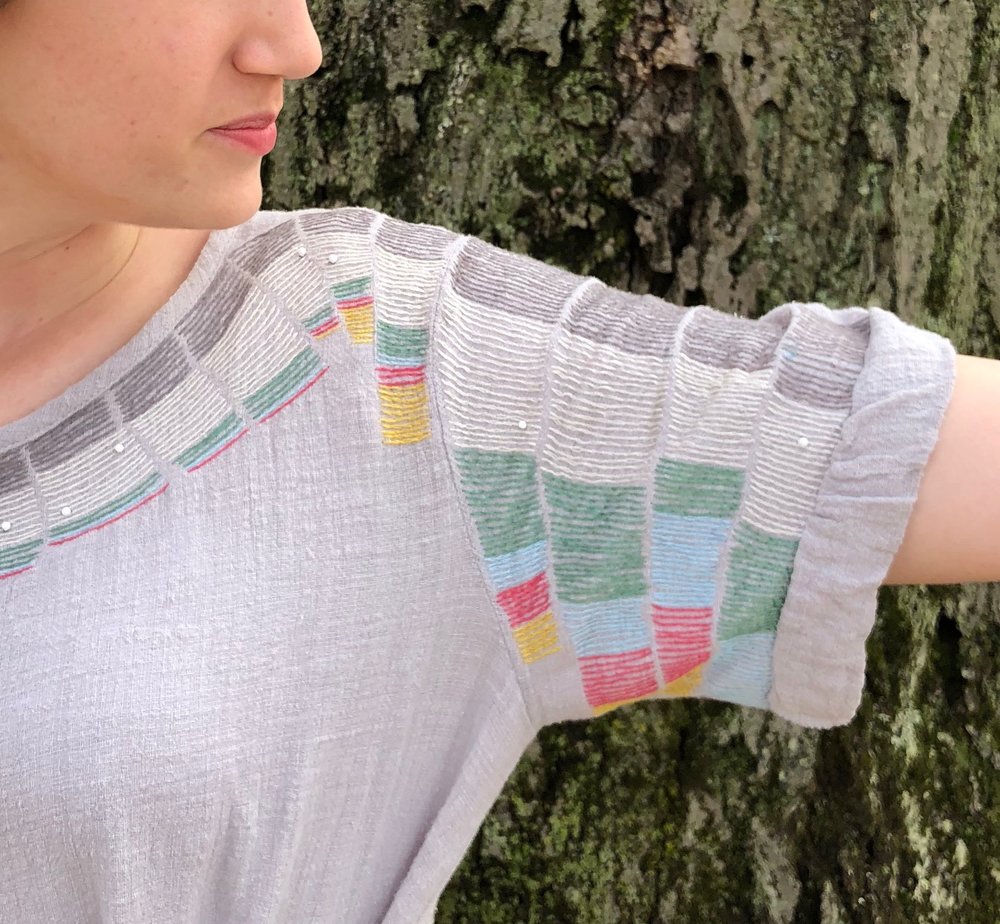
“The Data Dress project has been a way for me to explore what life looked like for American women my age throughout time,” Libby said. “I chose to represent the data through embroidery as a way to honor the labor and skill of women throughout the centuries. One hundred and fifty years ago, a huge percentage of women were either housewives, factory girls, or seamstresses. Now I’m doing similar embroidery work, but while pursuing a graduate degree at a respected university. Digital tools like Adobe CC and Tableau have opened up so many options in terms of design, but there’s something so nice about working with your hands! It’s easy to get lost in your screens, but there’s still a whole world of physical objects around us, and actually making things in real life is very empowering.”
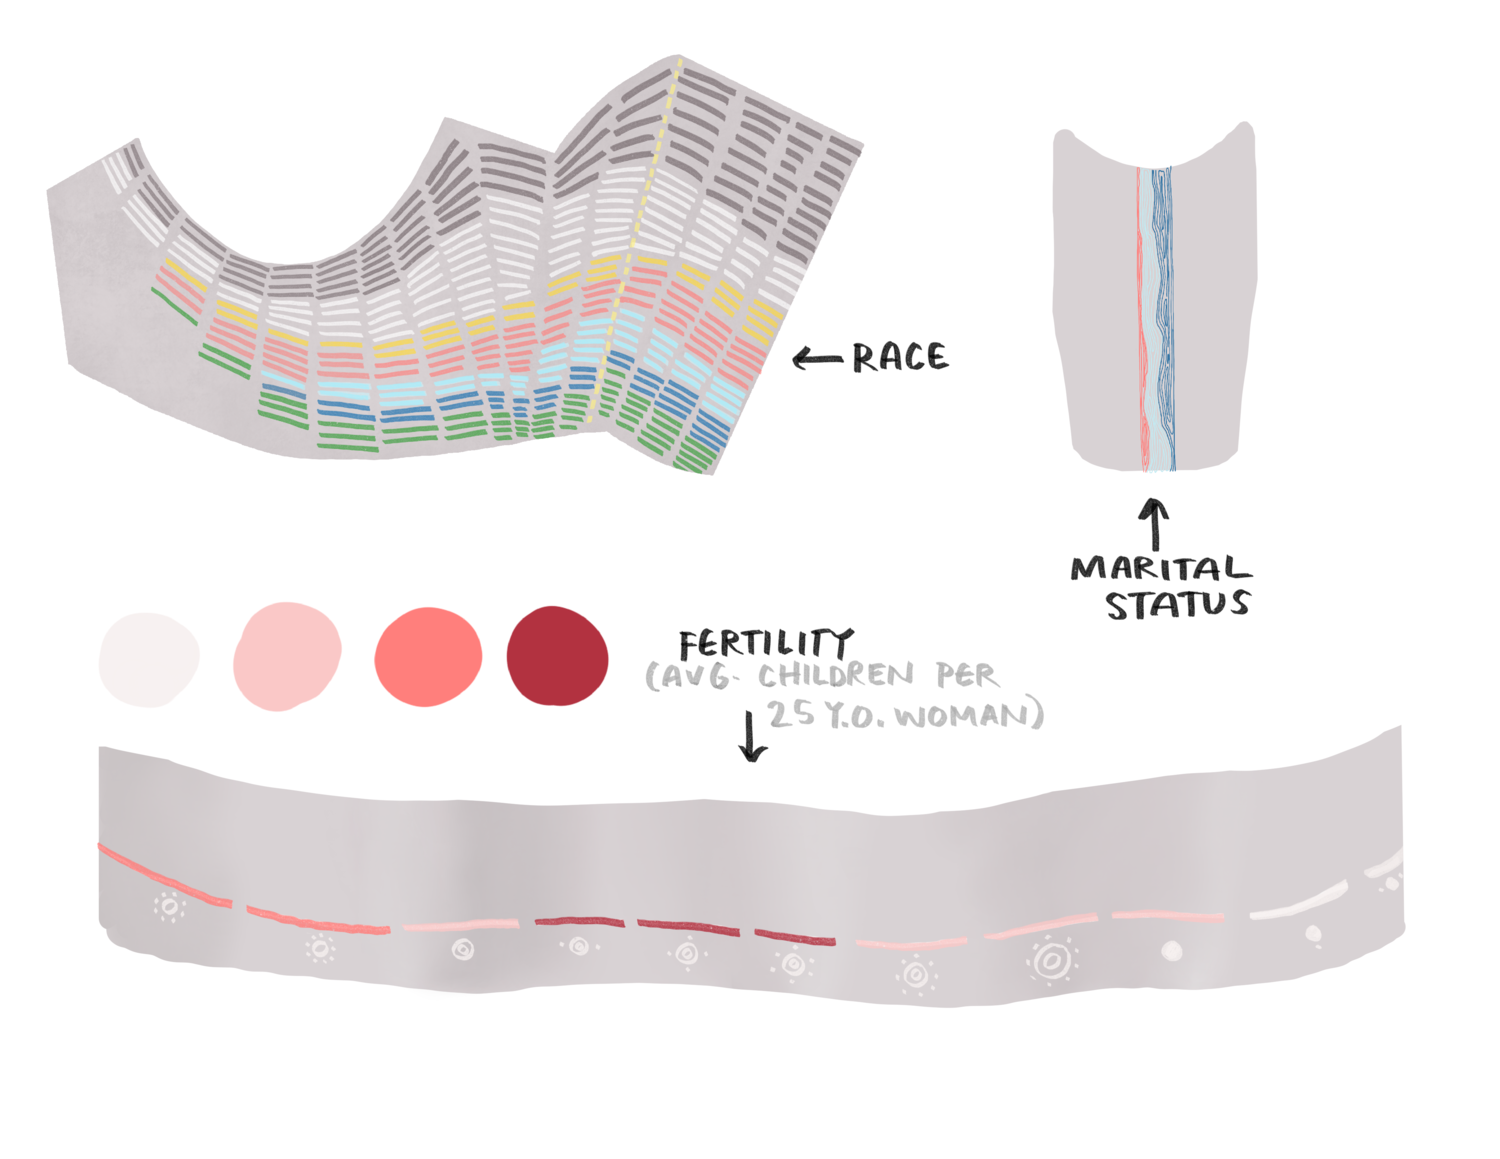
For the Data Dress, Libby downloaded U.S. Census data from 1850-2010, filtering so that she received data for her target group: females, aged 25. She explored variables including race, marital status, employment status, age at first marriage, number of children, and level of education. She then found ways to represent that data via embroidery patterns on a dress.

“From a distance, it just looks like interesting patterns. But when you get closer up you realize that it’s actually representing data about thousands of real women. I wanted the dress to be both practical and beautiful, something that a woman from any of the decades I researched would be happy to wear,” Libby explained.
Libby joined Northeastern’s Information Design and Visualization graduate program as a way to create projects, like this Data Dress, that are both beautiful and useful.
“In a world overrun with ‘fake news,’ training to understand and clearly convey the truth feels like a service profession, almost like training to become a nurse during World War II. Another bonus: Since I’m an Information Designer, I am always learning new things, about all sorts of fascinating topics!” she concluded.
When it comes to the learnings from her final project, a few takeaways included: let the data direct your design ideas, recognize that everyone has their own unique style of design, adjust your timeline as you learn how long things take, and look for opportunities to blend data and objects in the physical world.
To learn more about Libby’s project, her creative process, and takeaways, please visit her website.