

Departments In This Story
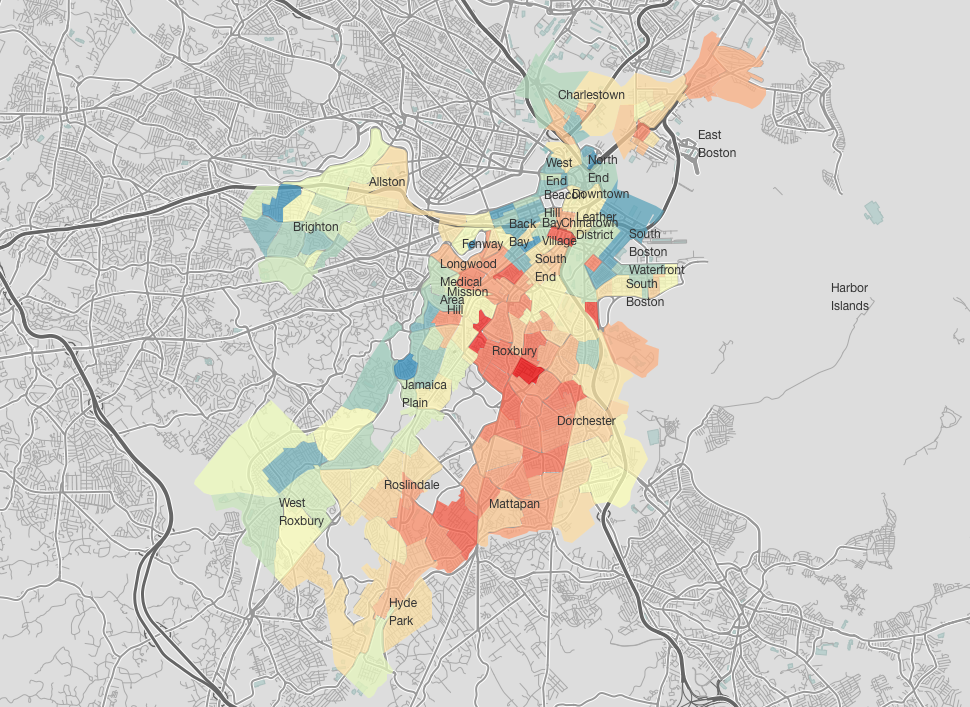
Daniel Hartman, AMD’15, created a data tool that helps visualize the stark income disparities that are prevalent in Boston. His work was recently featured in The Boston Globe.
Daniel Hartman analyzed different measures of wealth and poverty in Boston for a graduate-level class in visualization technologies at Northeastern University. Using data from the 2009-2013 American Community Survey, he mapped each of the 166 primary Census tracts in Boston, using a number of metrics, including unemployment, rent burden, household income, commute times, home ownership, and families under the poverty level. (See his results at hartman.dj/boston).
Related News

CAMD faculty present results of Creative Catalyst Program
August 20, 2026

New Faculty Joining CAMD
August 5, 2026

Ilya Vidrin wins major grant for embodied ethics research
August 5, 2026